Profiling and Accelerating C++ Applications and Algorithms
Oct 08, 2019
For many embedded systems, the amount of processing bandwidth is limited by processor performance. Some SoCs provide dedicated acceleration blocks but they are often limited to very specific applications. If an application taxes the processor utilization or lacks performance, the first step would be to profile it to see where it is spending most of its execution time.
As an example, we will look at a simple application that contains three distinct video type algorithms. The code takes multiple frames of data through color to the grayscale algorithm, followed by an image sharpening algorithm, then an edge detection algorithm as shown in the figure below.

Running the application on a Zynq® UltraScale+™ Quad-Core 1.3 GHz A53 Linux system, the application completed in about 24 seconds. Time was measured using the clock_gettime function before and after the three main functions.
If the code does not meet its performance target, we would want to profile the application to understand which functions are impacting the processor bandwidth.
The Xilinx® Vitis™ unified software platform provides a non-intrusive Target Communication Framework (TCF) profiler which can be used to profile our application. The communication between the host and the embedded target is over Ethernet. The profiler will continuously sample the processor execution and gather statistics per function call.
Refer to the TCF profiling section in the Vitis tool help menu for details on how to set up and use the TCF profiler.
The Figure below shows the profiling information for our Linux application.
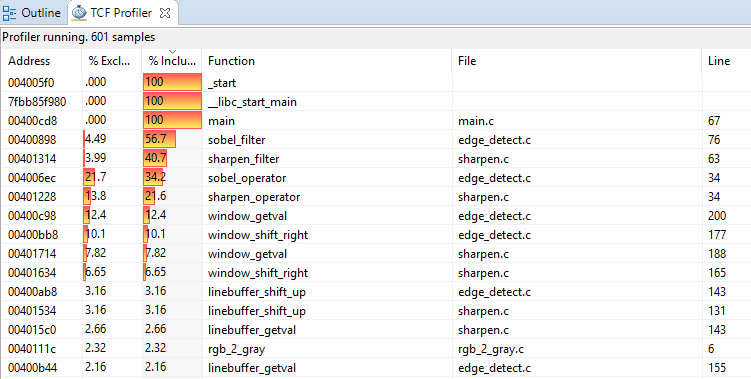
The first column provides the address for the function. The second column shows the exclusive percentage. The third column shows the inclusive percentage. The fourth column provides the name of the function. The fifth column provides the name of the file where that function is located. The important metrics in the figure are the %exclusive and %inclusive columns.
% exclusive is the percentage of samples for that function only, excluding samples of any child functions. A child' function would be a function executed within the current function.
% inclusive is the percentage of samples of a function, including samples collected during the execution of any child functions.
A high inclusive percentage indicates that the function executed for a long time. Since it includes child functions, the function itself might not have done a lot of processing. A high exclusive percentage indicates that the actual function did a lot of processing. When profiling it is usually best to optimize functions with a high exclusive percentage.
In our example, the application spent most of its time in the sobel_filter function at 56.7%. Within this function, the sobel_operator function has the highest exclusive percentage at 21.7%. Two other functions inside the sobel_filter function, window_getval and window_shift_right also had a high exclusive percentage. Therefore, optimizing or accelerating the sobel_filter function and its children's functions would provide the most benefit.
The sobel operator code shown below convolves the X and Y gradients of a 3x3 matrix. When deciding to accelerate functions it is important to choose functions that have a large compute load, as the latency to move data to and from the hardware accelerator needs to be smaller than the time it would take for the processor to execute the same code.
    //Compute approximation of the gradients in the X-Y direction
for (i = 0; i < WIDOW_HEIGHT; i++) {
	for (j = 0; j < WIDOW_WIDTH; j++) {

		// X direction gradient
		x_weight = x_weight + (window_getval(window, i, j) * x_op[i][j]);

		// Y direction gradient
		y_weight = y_weight + (window_getval(window, i, j) * y_op[i][j]);
	}
}
In a standard GPU or discrete embedded processor, short of rewriting the code or writing assembly code, programmers have very limited options to speed up functions. Xilinx SoCs provide the flexibility, scalability, and performance of the programmable logic which is tightly coupled to the processor system.
Using Vitis Integrated Design Environment, developers can specify functions, called kernels, that will be accelerated in the programmable logic. Each kernel is loaded at runtime as part of the application execution. The host application loads and interacts with the kernels through an OpenCL API. At the hardware level, high-performance AXI4 interfaces are used to transfer the data between memory and the accelerators. A simplified block diagram below shows the acceleration setup.

Vitis IDE provides developers the ability to compile and debug applications including hardware kernels. In our example, the sobel_filter function is compiled as a kernel located in programmable logic to accelerate its functionality. The kernel will replace the original C++ implementation of the sobel_filter. The original application was also modified to declare and load the new kernel.
Refer to the Vitis tool Programmer’s Guide (UG1357) for more information on configuring the host application and programming kernels.
With the kernel in place, the application was executed on the target and completed in about 10 seconds. It is a 2.4x improvement over the original C++ only code.
Profiling an application provides good information in code execution and performance bottlenecks. Vitis non-intrusive profiling is easy to set up and has no impact on the code behavior. However, profiling is only advantageous if the user can accelerate the functions which have a high processing load. Having the ability to create dedicated acceleration kernels inside the programmable logic of Xilinx SoCs provides great flexibility and major performance improvements for embedded system developers while retaining the ease-of-use of programming in OpenCL and C++.