
Choosing AMD can transform your data center and advance your business
AMD EPYC™ processors are the world’s best data center CPUs. They deliver the data center computing performance that enterprises require to meet customer demands, can reduce rack footprint, offer energy efficient performance, and can deploy AI workloads at scale.
Modernize and Consolidate to Prepare for AI Initiatives
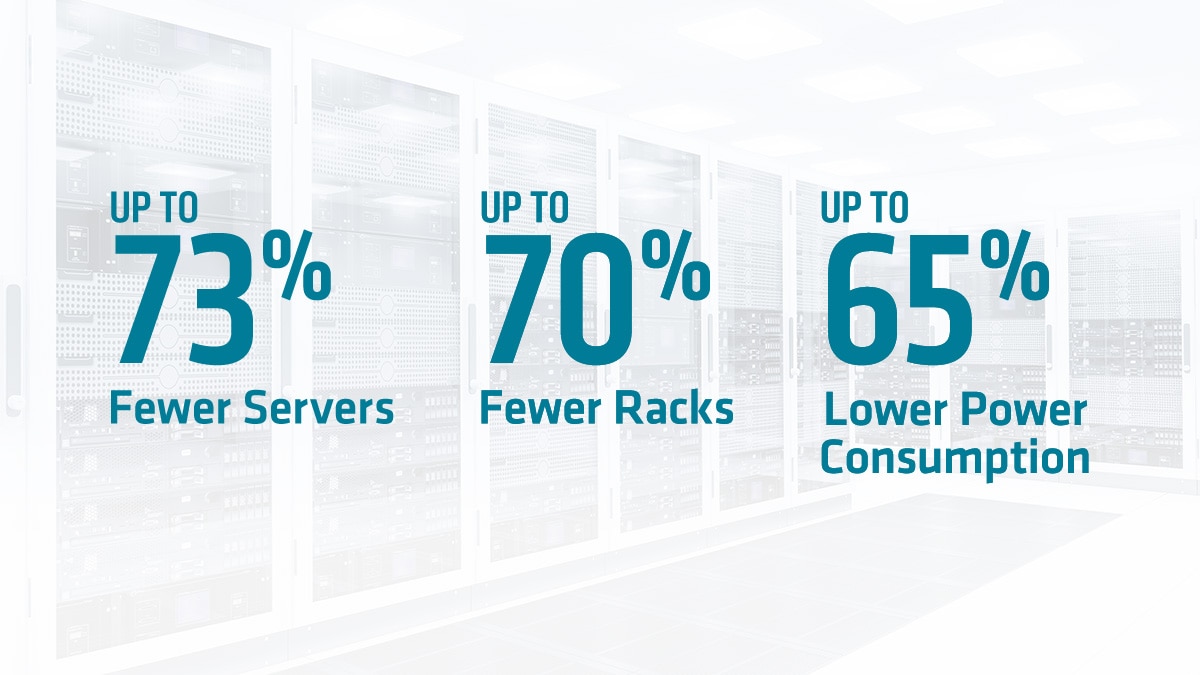
Enterprises are implementing AI technology to stay competitive, but it can be challenging for IT leaders. Adding AI applications to the enterprise can strain the capabilities of existing data center infrastructure. That is why modernization is key. For example, when upgrading from Intel Xeon Gold 6143 to 4th Gen AMD EPYC 9334, organizations can use up to 73% fewer servers, 70% fewer racks, and 65% less power to reach a SPECrate® integer score of at least 80,000.1

Why Choose AMD EPYC™
Selecting the right data center processor for your next server deployment can help your IT organization get more performance and density while maintaining or reducing their data center footprints.
For example, reaching a SPECrate® integer score of at least 10,000 would require 11 of the latest dual socket Intel Xeon Platinum 8490H based servers but only 6 dual socket AMD EPYC 9654 powered servers.2
Servers powered by 4th Gen AMD EPYC processors can help you:
- Run the same workloads with fewer servers
- Reduce operational and energy costs
- Free up precious data center space and power and allocate this capacity for new workloads and services
Choose AMD for your data center AI deployments
When it comes to AI workloads, requirements are diverse and continue to evolve. Both CPUs and GPUs can excel in running AI inference workloads – with different characteristics and deployment scenarios. AMD offers AI performance and efficiency leadership for both CPUs and GPU accelerators for data center deployments.
World’s Best Data Center CPUs
4th Gen AMD EPYC processors help enterprises achieve faster time to insights to accelerate business. AI inference is best deployed on EPYC CPUs when model sizes are smaller and when AI is a smaller percentage of the overall server workload mix.
AI compute load is one of many factors that impact overall performance of a server when deployed in the enterprise. To get a better sense of the overall capabilities of a server, it is important to look at the end-to-end pipeline. When compared to servers with 2x top of the line 64c 5th Gen Xeon, servers deployed with 2x 96c 4th Gen EPYC processors deliver 1.65x the performance per server running the TPCx-AI SF30 benchmark.³

World’s Highest Performance Data Center GPU Accelerators
AMD Instinct™ accelerators deliver leadership performance for the most demanding AI and HPC workloads, with MI300X providing up to 1.3X the performance in AI precisions vs. Nvidia H100 SXM (80GB) accelerators⁴. In addition to AI model training, AMD Instinct GPUs are ideal for inference on dedicated AI deployments, where AI comprises a larger portion of the overall server workload mix, or when real-time inference response is critical for the application.


Solutions
AMD works with a variety of partners to design and develop optimized solutions featuring 4th Gen AMD EPYC.
Deliver More with AMD EPYC
4th Gen AMD EPYC processors are designed to deliver accelerated business results by consolidating infrastructure and helping reduce CAPEX and OPEX.
Learn how you can add more performance and efficiency to your data center, helping lower costs, energy consumption, and server footprint.
Trusted by Thousands of Businesses
On-prem or in the cloud, discover how other companies successfully deployed AMD EPYC processors.


Sign up to receive the latest data center news and content.


Footnotes
- SP5TCO-055: This scenario contains many assumptions and estimates and, while based on AMD internal research and best approximations, should be considered an example for information purposes only, and not used as a basis for decision making over actual testing. The Bare Metal Server Greenhouse Gas Emissions TCO (total cost of ownership) Estimator Tool – v9.37 Pro Refresh, compares the selected AMD EPYC™ and Intel® Xeon® CPU based server solutions required to deliver a TOTAL_PERFORMANCE of 80,000 units of integer performance based on the published scores for these specific Intel Xeon and AMD EPYC CPU based servers as of June 1, 2023. This estimation reflects a 3-year time frame with a PUE of 1.7 and a power US power cost of $0.128 / kWh. This analysis compares a 2P AMD 32 core EPYC 9334 CPU powered server with a SPECrate®2017_int_base a score of 725, https://spec.org/cpu2017/results/res2023q1/cpu2017-20230102-33282.pdf; to a 2P Intel Xeon 16 core Gold_6143 based server with a SPECrate®2017_int_base score of 197, https://spec.org/cpu2017/results/res2017q4/cpu2017-20171114-00863.pdf. Due to the wide variation of costs for real estate or admins, this TCO does not include their costs in this analysis. New AMD powered server OpEx consists of power only. The OpEx for the legacy install base of servers with Intel CPUs consists of power plus the extended warranty costs. Cost to extend the server warranty support is calculated to be 20% annually of the initial purchase price which is calculated using 2023 costs. Using this and the power costs mean that the AMD solution for a 3yr TCO is more than $2.5 million less (62% less) and has a $1.2 million or 93% lower annual OpEx. Environmental impact estimates made leveraging this data, using the Country / Region specific electricity factors from the '2020 Grid Electricity Emissions Factors v1.4 – September 2020', and the United States Environmental Protection Agency 'Greenhouse Gas Equivalencies Calculator'. For additional details, see https://www.amd.com/en/claims/epyc4#SP5TCO-055
- SP5TCO-032: This scenario contains many assumptions and estimates and, while based on AMD internal research and best approximations, should be considered an example for information purposes only, and not used as a basis for decision making over actual testing. The Bare Metal Server Greenhouse Gas Emissions TCO (total cost of ownership) Estimator Tool - version 6.80, compares the selected AMD EPYC™ and Intel® Xeon® CPU based server solutions required to deliver a TOTAL_PERFORMANCE of 10,000 units of integer performance based on the published scores for these specific Intel Xeon and AMD EPYC CPU based servers as of January 10, 2023. This estimation reflects a 3-year time frame with a PUE of 1.7 and a power US power cost of $0.16 / kWh. This analysis compares a 2P AMD 96 core AMD EPYC_9654 powered server with a SPECrate2017_int_base score of 1790, https://spec.org/cpu2017/results/res2022q4/cpu2017-20221024-32607.pdf; to a 2P Intel Xeon 60 core Platinum_8490H based server with a SPECrate2017_int_base score of 991, https://spec.org/cpu2017/results/res2023q1/cpu2017-20221206-33039.pdf. Environmental impact estimates made leveraging this data, using the Country / Region specific electricity factors from the '2020 Grid Electricity Emissions Factors v1.4 – September 2020', and the United States Environmental Protection Agency 'Greenhouse Gas Equivalencies Calculator'. For additional details, see https://www.amd.com/en/claims/epyc4#SP5TCO-032.
- SP5-051A: TPCx-AI SF30 derivative workload comparison based on AMD internal testing running multiple VM instances as of 4/13/2024. The aggregate end-to-end AI throughput test is derived from the TPCx-AI benchmark and as such is not comparable to published TPCx-AI results, as the end-to-end AI throughput test results do not comply with the TPCx-AI Specification. AMD system configuration: Processors: 2 x AMD EPYC 9654; Frequencies: 2.4 GHz | 3.7 GHz; Cores: 96 cores per socket (1 NUMA domain per socket); L3 Cache: 384MB/socket (768MB total); Memory: 1.5TB (24) Dual-Rank DDR5-5600 64GB DIMMs, 1DPC (Platform supports up to 4800MHz); NIC: 2 x 100 GbE Mellanox CX-5 (MT28800); Storage: 3.2 TB Samsung MO003200KYDNC U.3 NVMe; BIOS: 1.56; BIOS Settings: SMT=ON, Determinism=Power, NPS=1, PPL=400W, Turbo Boost=Enabled; OS: Ubuntu® 22.04.3 LTS; Test config: 6 instances, 64 vCPUs/instance, 2663 aggregate AI use cases/min vs. Intel system configuration: Processors: 2 x Intel® Xeon® Platinum 8592+; Frequencies: 1.9 GHz | 3.9 GHz; Cores: 64 cores per socket (1 NUMA domain per socket); L3 Cache: 320MB/socket (640MB total); Memory: 1TB (16) Dual-Rank DDR5-5600 64GB DIMMs, 1DPC; NIC: 4 x 1GbE Broadcom NetXtreme BCM5719 Gigabit Ethernet PCIe; Storage: 3.84TB KIOXIA KCMYXRUG3T84 NVMe; BIOS: ESE124B-3.11; BIOS Settings: Hyperthreading=Enabled, Turbo boost=Enabled, SNC=Disabled; OS: Ubuntu® 22.04.3 LTS; Test config: 4 instances, 64 vCPUs/instance, 1607 aggregate AI use cases/min. Results may vary due to factors including system configurations, software versions and BIOS settings. TPC, TPC Benchmark and TPC-C are trademarks of the Transaction Processing Performance Council.
- MI300-17: Measurements conducted by AMD Performance Labs as of November 11th, 2023 on the AMD Instinct™ MI300X (750W) GPU designed with AMD CDNA™ 3 5nm | 6nm FinFET process technology at 2,100 MHz peak boost engine clock resulted in 653.7 TFLOPS peak theoretical TensorFloat-32 (TF32), 1307.4 TFLOPS peak theoretical half precision (FP16), 1307.4 TFLOPS peak theoretical Bfloat16 format precision (BF16), 2614.9 TFLOPS peak theoretical 8-bit precision (FP8), 2614.9 TOPs INT8 floating-point performance. The MI300X is expected to be able to take advantage of fine-grained structure sparsity providing an estimated 2x improvement in math efficiency resulting 1,307.4 TFLOPS peak theoretical TensorFloat-32 (TF32), 2,614.9 TFLOPS peak theoretical half precision (FP16), 2,614.9 TFLOPS peak theoretical Bfloat16 format precision (BF16), 5,229.8 TFLOPS peak theoretical 8-bit precision (FP8), 5,229.8 TOPs INT8 floating-point performance with sparsity. Published results on Nvidia H100 SXM (80GB) 700W GPU resulted in 989.4 TFLOPs peak TensorFloat-32 (TF32) with sparsity, 1,978.9 TFLOPS peak theoretical half precision (FP16) with sparsity, 1,978.9 TFLOPS peak theoretical Bfloat16 format precision (BF16) with sparsity, 3,957.8 TFLOPS peak theoretical 8-bit precision (FP8) with sparsity, 3,957.8 TOPs peak theoretical INT8 with sparsity floating-point performance. Nvidia H100 source: https://resources.nvidia.com/en-us-tensor-core. MI300-17